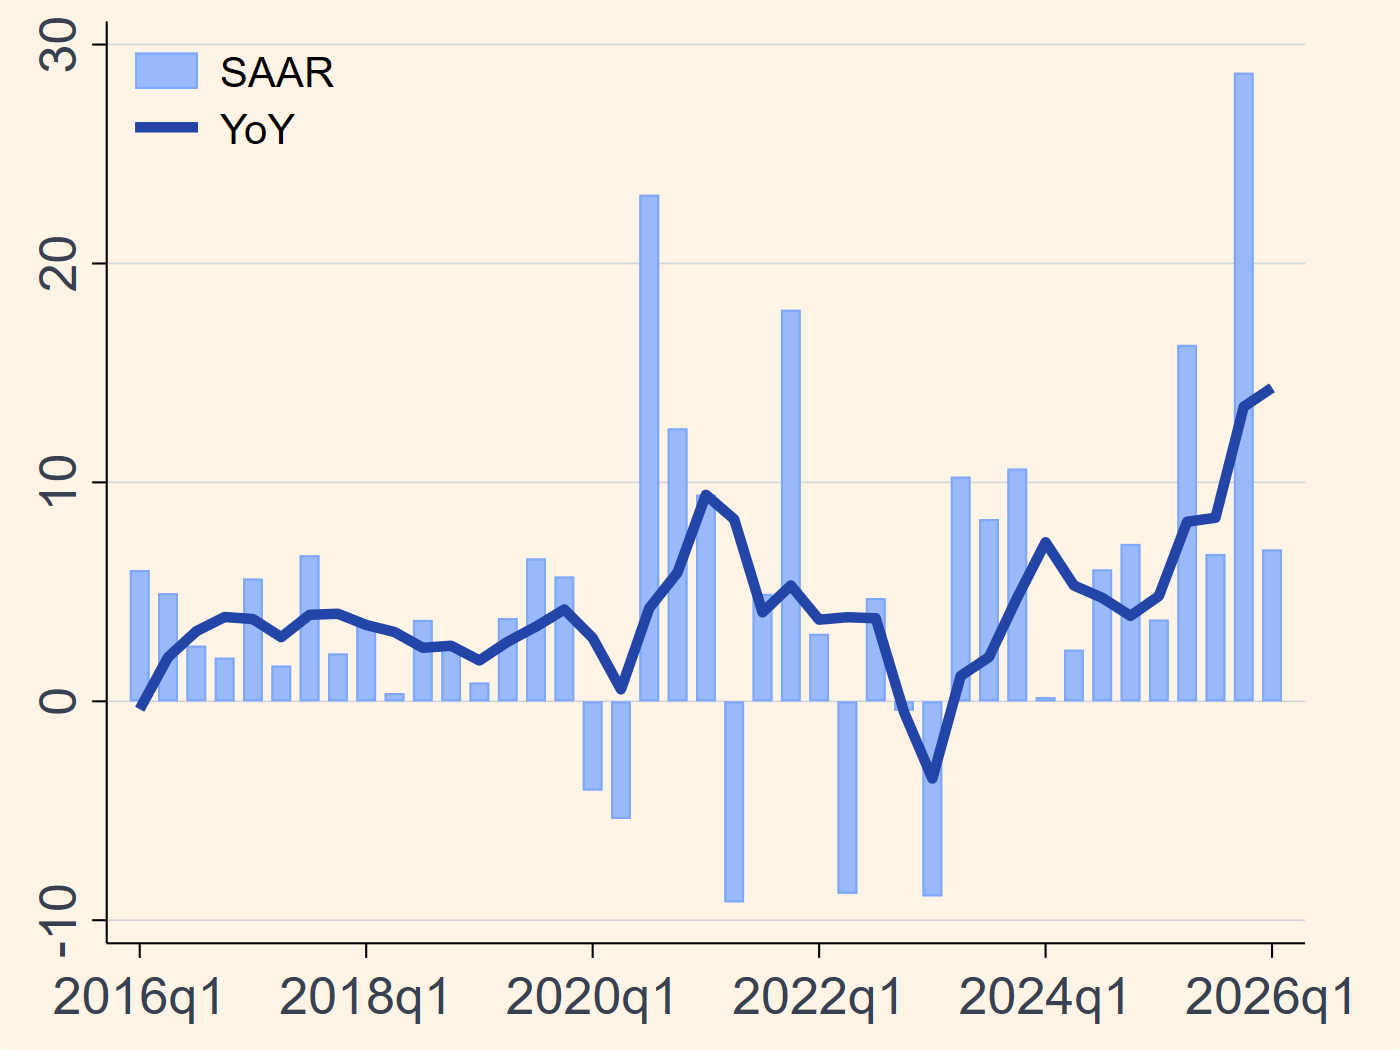
Charts - Taiwan

Mapping macro and market conditions in Taiwan

Japan Korea Taiwan Hong Kong Singapore

GDP Growth

Year-on-year and seasonally adjusted annualized rate, percent

Taiwan real GDP growth chart
Source: Zeng Macro Updated: 2026/06/06

Inflation

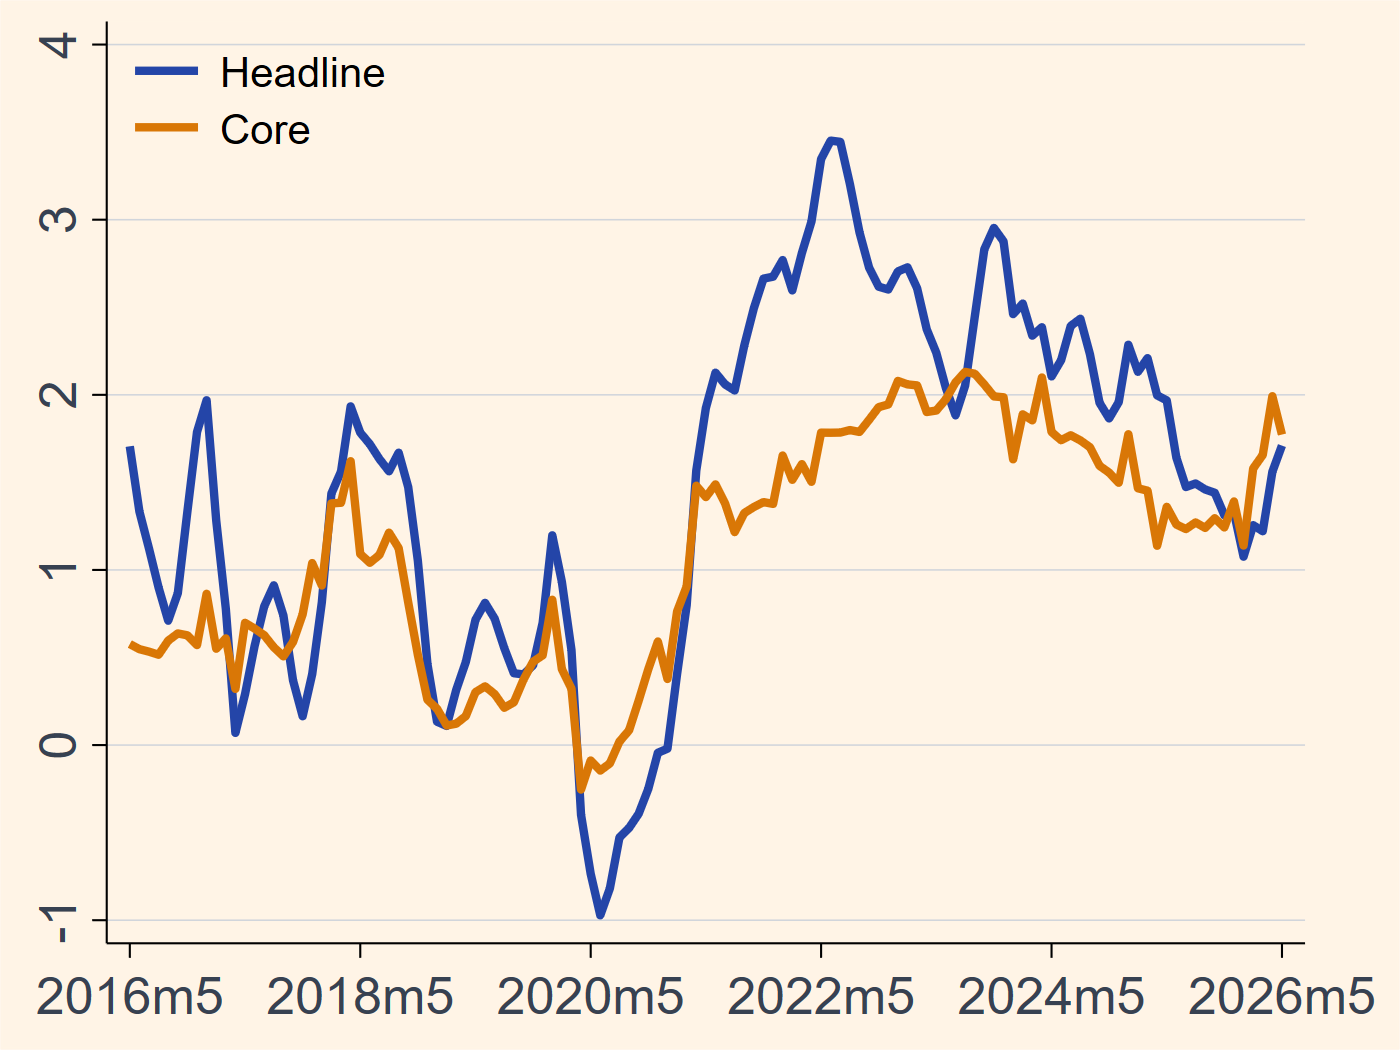
Headline and core CPI inflation, percent

Taiwan headline and core inflation chart
Source: Zeng Macro Updated: 2026/06/06

Unemployment

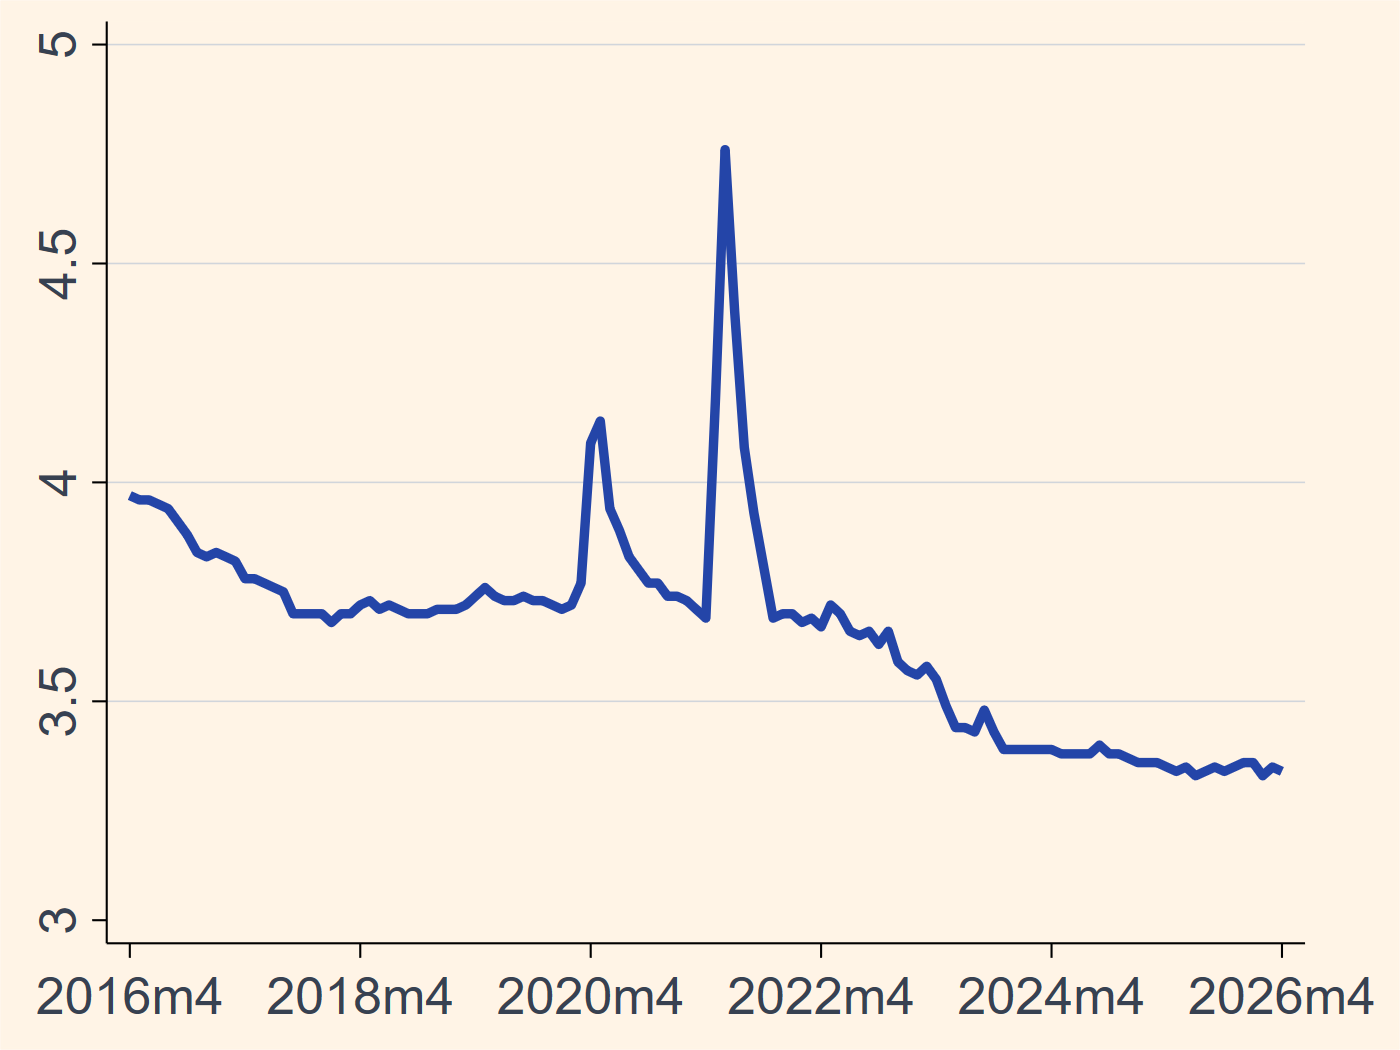
Total unemployment rate, percent

Taiwan unemployment rate chart
Source: Zeng Macro Updated: 2026/06/06

Interest Rates

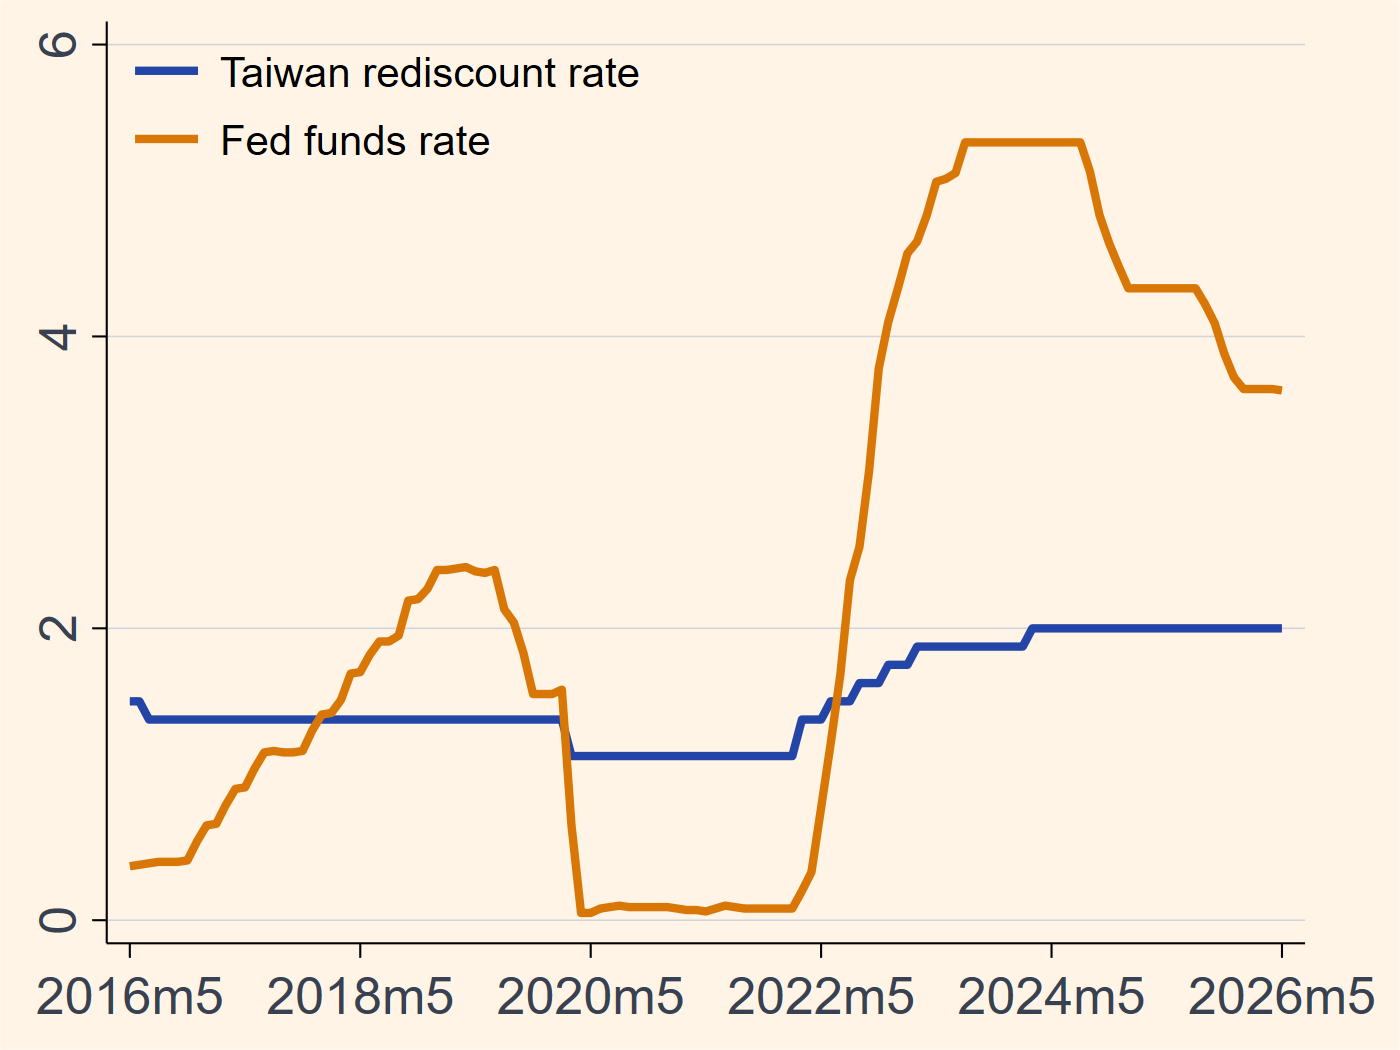
Policy rate vs. US Fed funds rate, percent
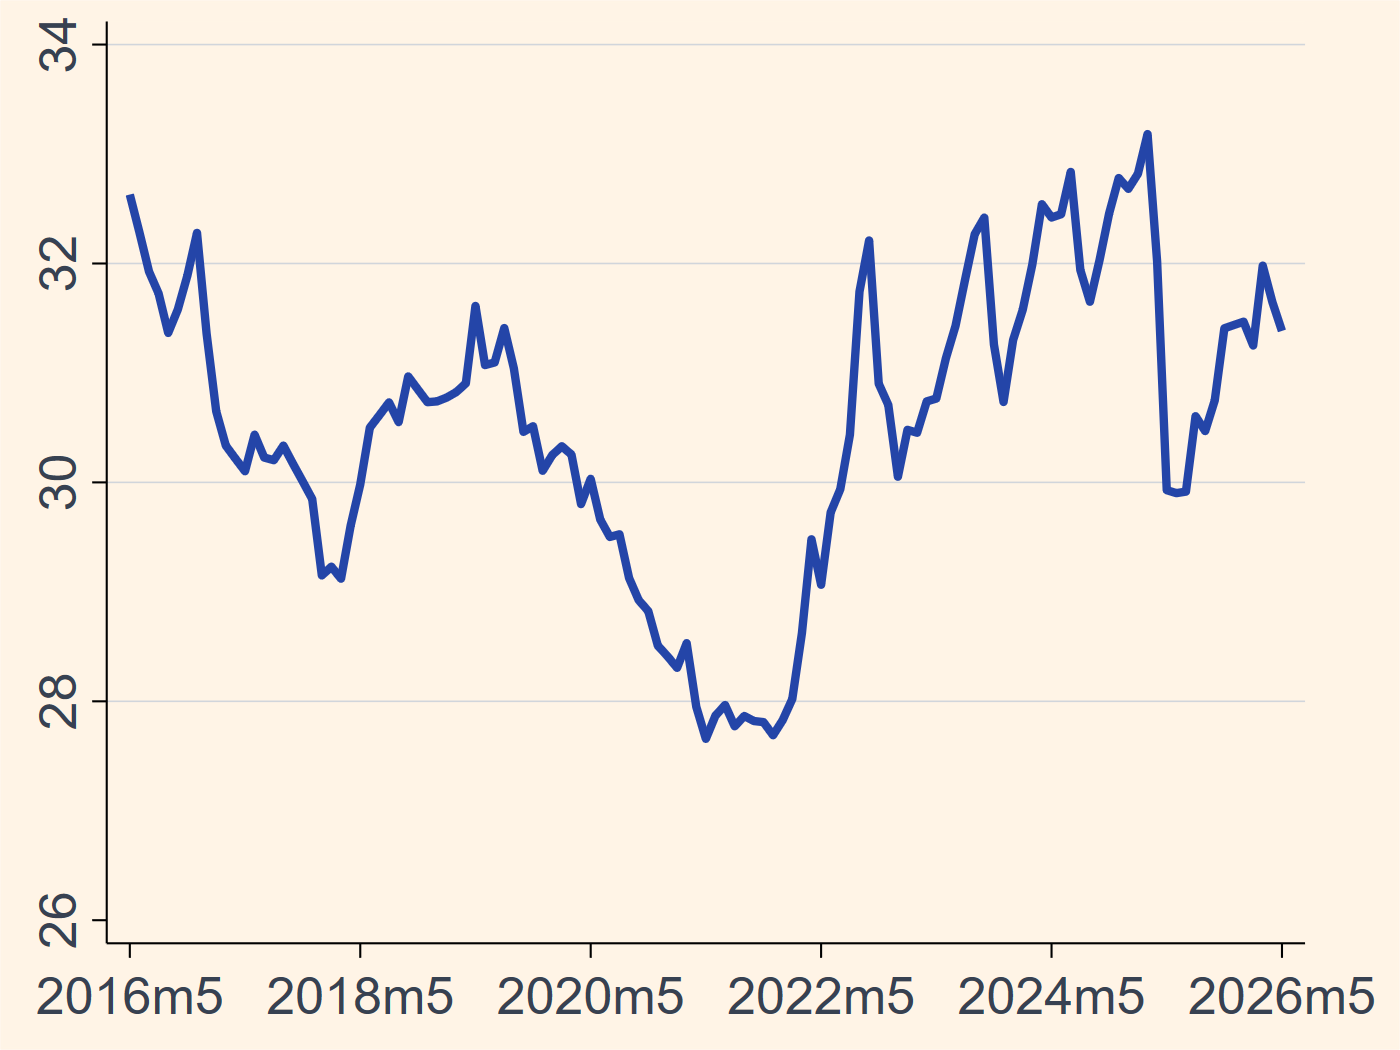
Taiwan policy rate versus US Fed funds rate
Source: Zeng Macro Updated: 2026/06/06

Exchange Rate

TWD per USD

Taiwan exchange rates chart
Source: Zeng Macro Updated: 2026/06/06

Export Growth

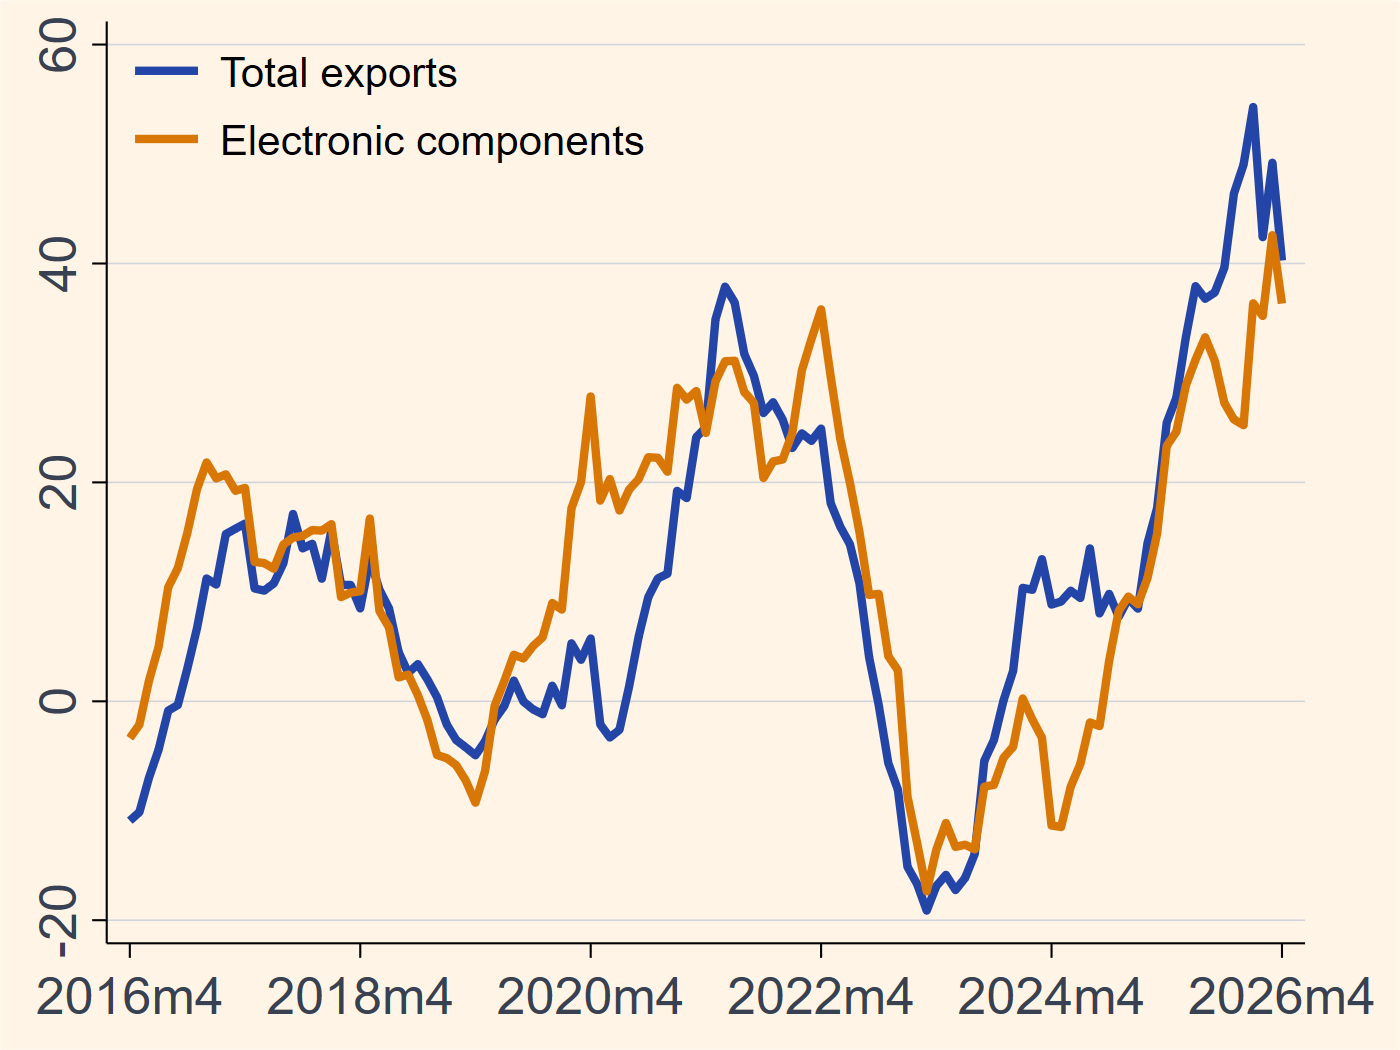
Total and electronic components exports, year-on-year percent

Taiwan exports growth chart
Source: Zeng Macro Updated: 2026/06/06