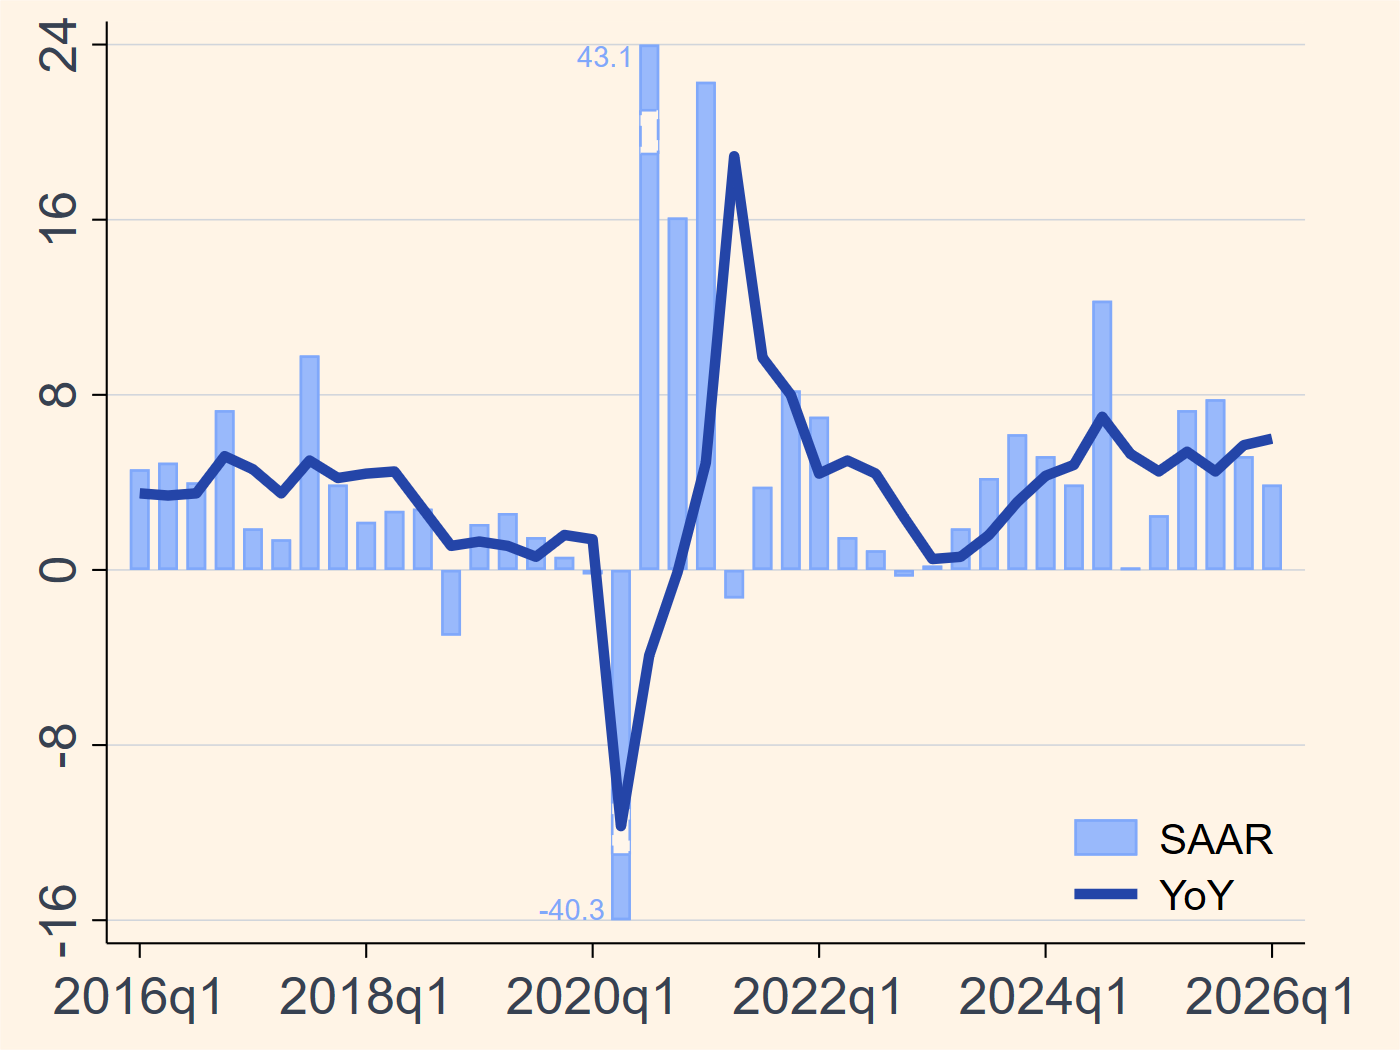
Charts - Singapore

Mapping macro and market conditions in Singapore

Japan Korea Taiwan Hong Kong Singapore

GDP Growth

Year-on-year and seasonally adjusted annualized rate, percent

Singapore real GDP growth chart
Source: Zeng Macro Updated: 2026/06/08

Inflation

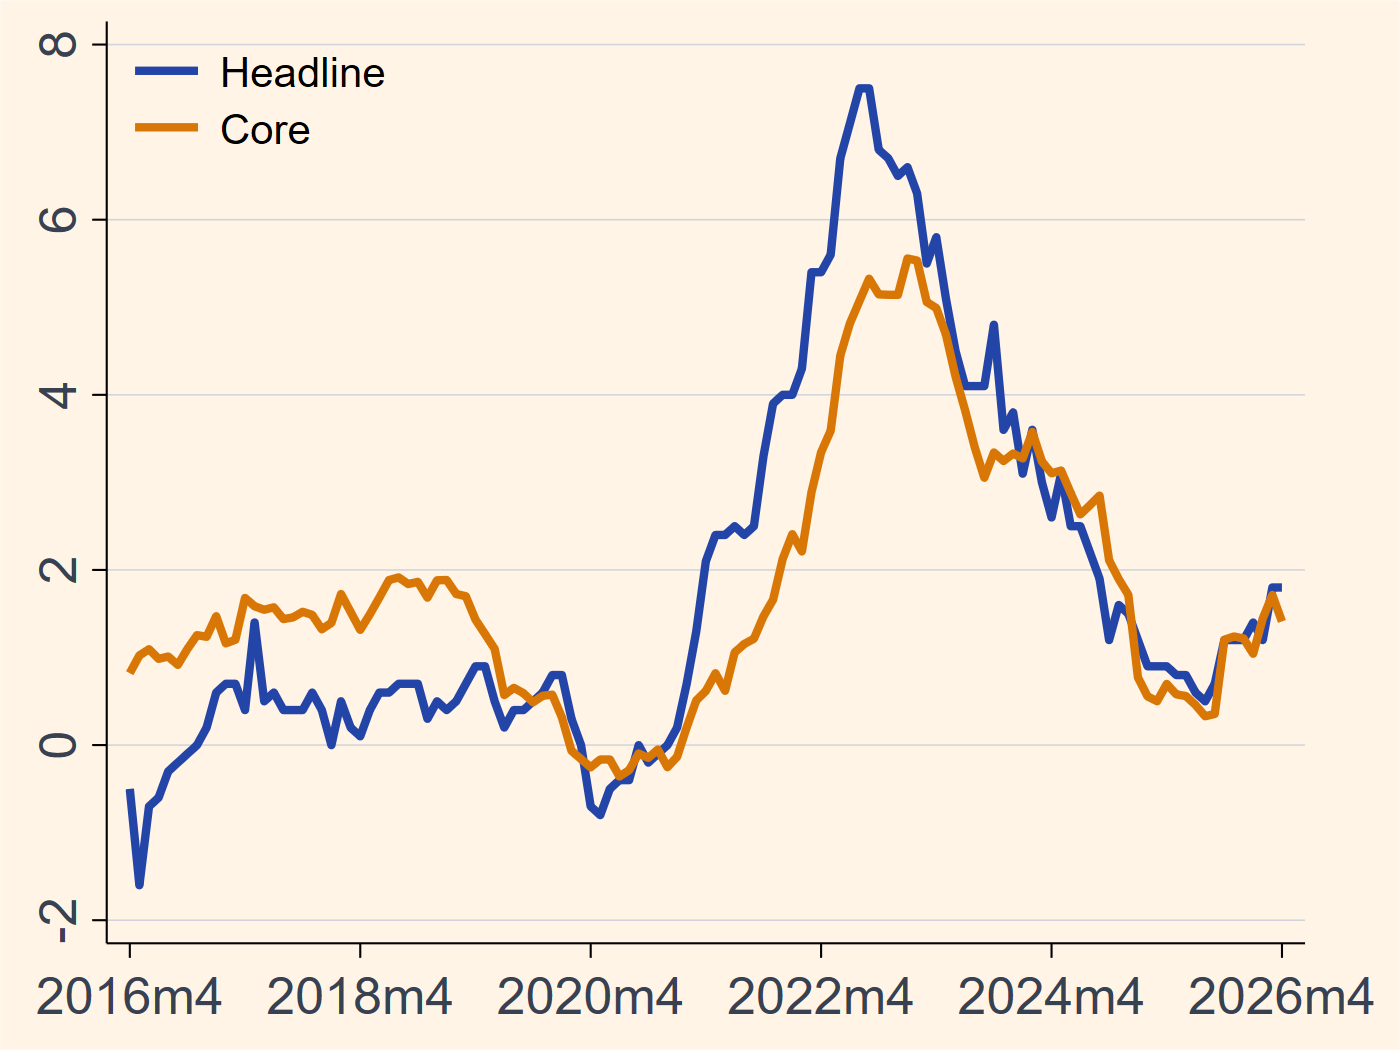
Headline and core CPI inflation, percent

Singapore headline and core inflation chart
Source: Zeng Macro Updated: 2026/06/08

Unemployment

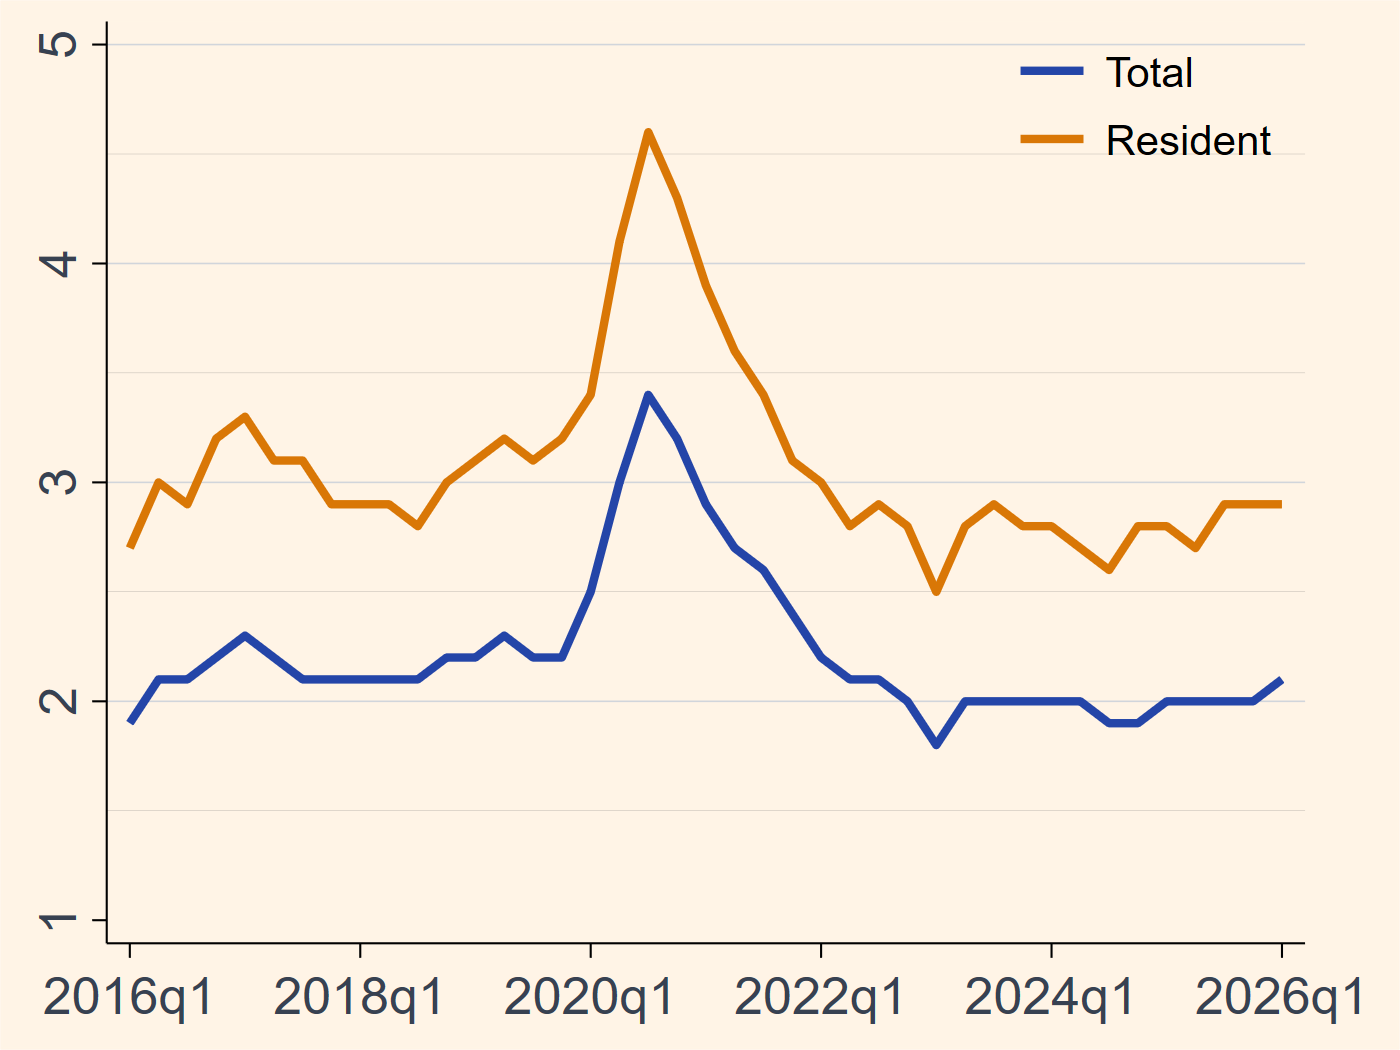
Total and resident unemployment rates, percent
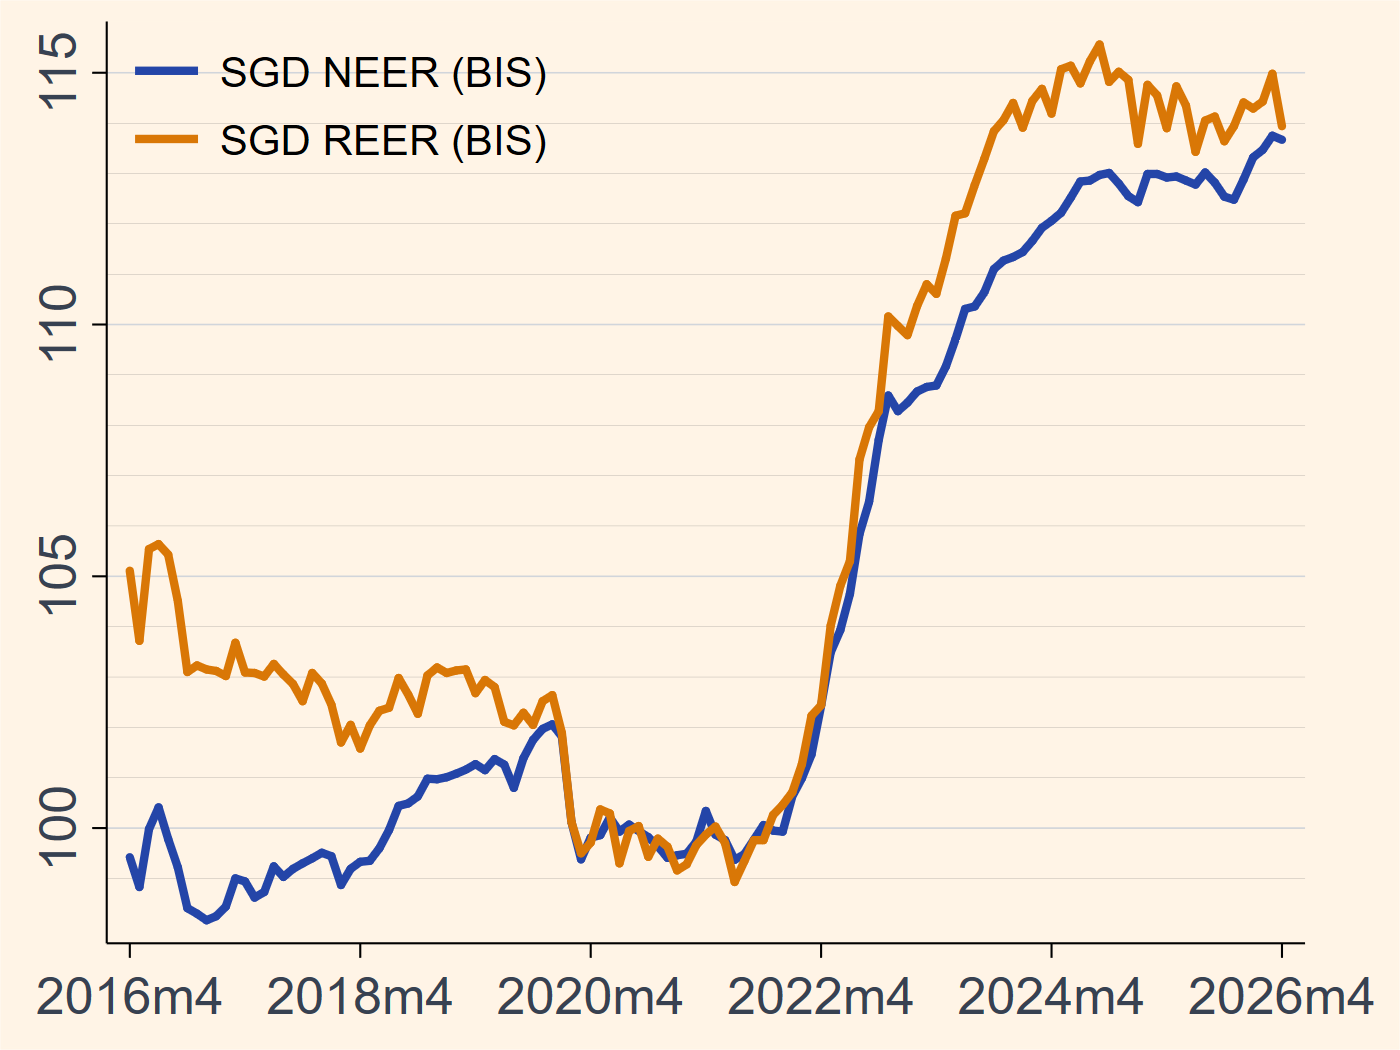
Singapore unemployment rate chart
Source: Zeng Macro Updated: 2026/06/08

Effective Exchange Rate Indices

2020 average = 100

Singapore NEER and REER chart
Source: Zeng Macro Updated: 2026/06/08

Exports and Imports

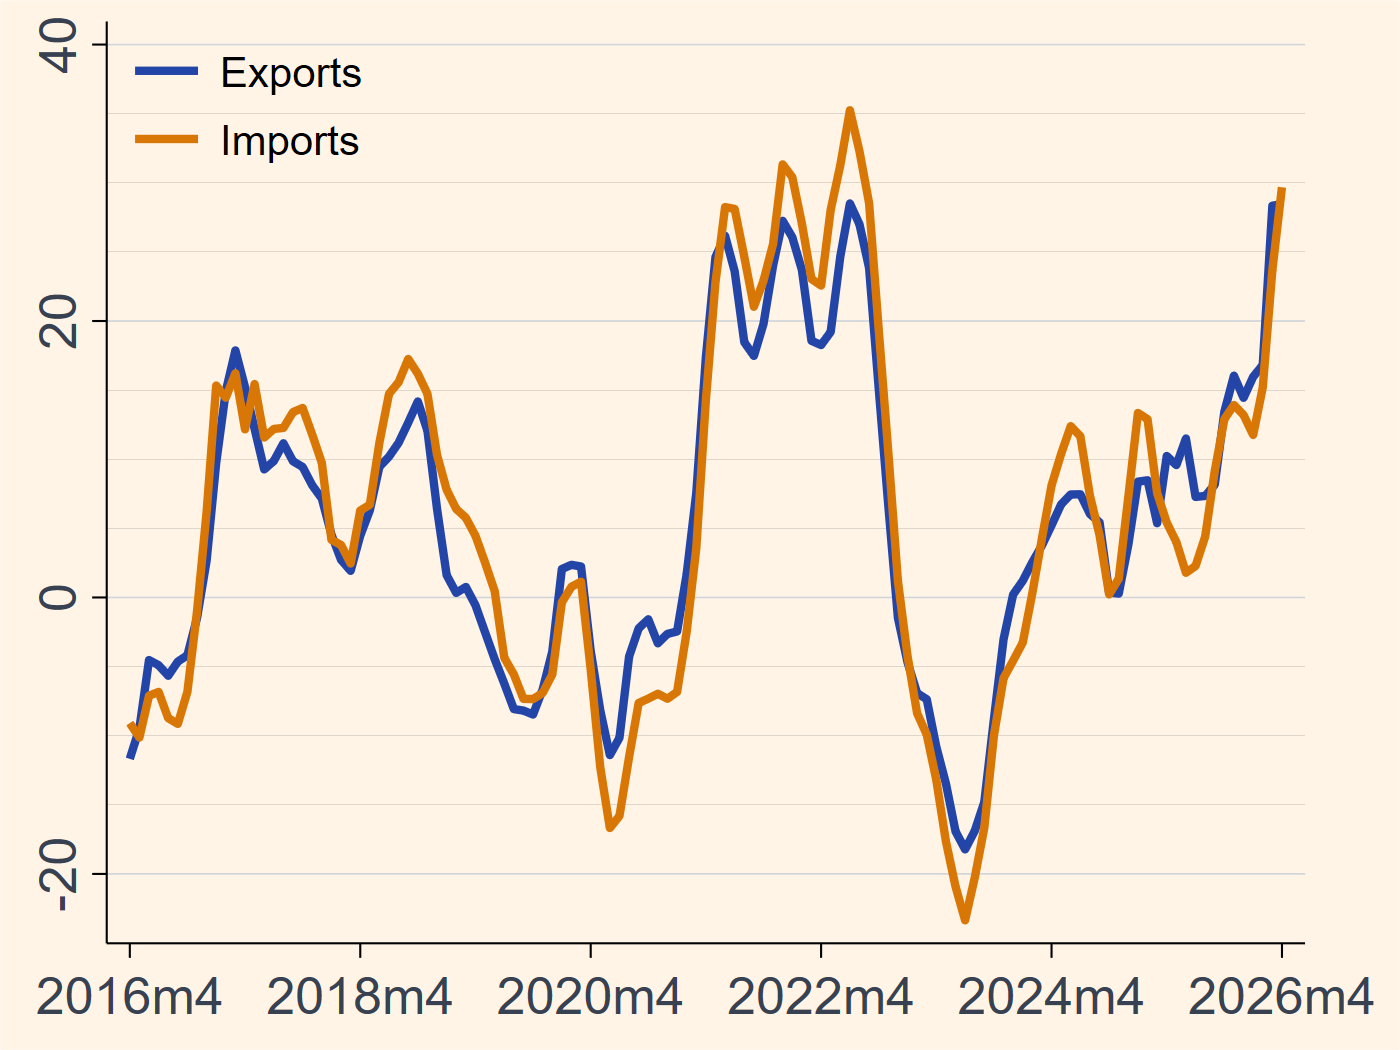
Year-on-year growth, percent

Singapore exports and imports growth chart
Source: Zeng Macro Updated: 2026/06/08

Current Account Balance

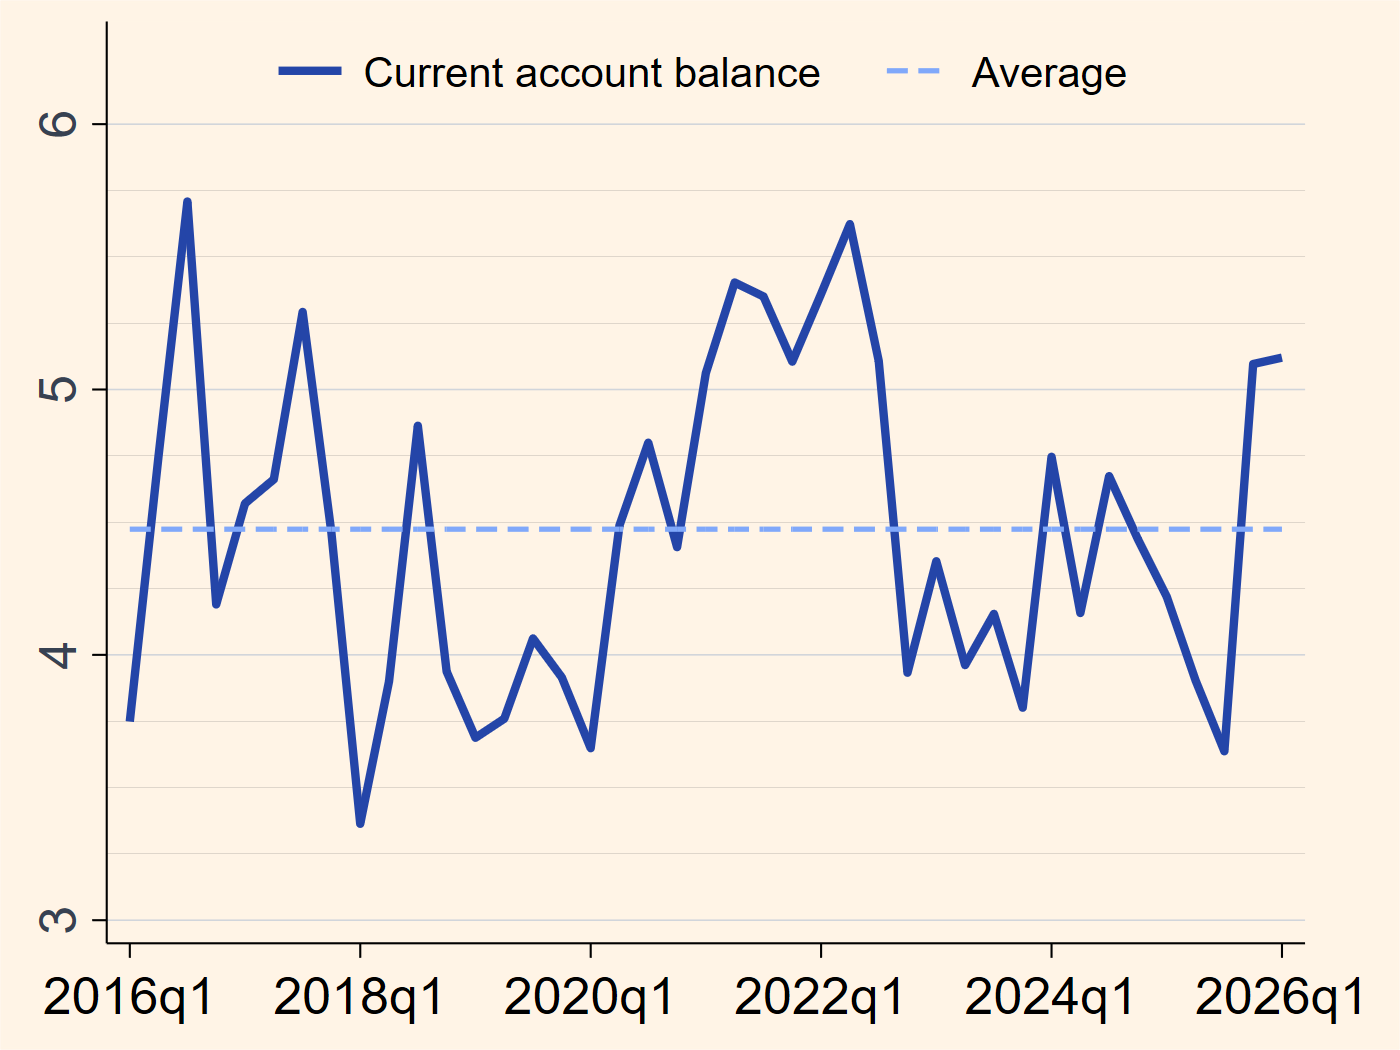
Percent of 4-Quarter Rolling GDP

Singapore current account balance
Source: Zeng Macro Updated: 2026/06/08